A guide to Facebook metrics
Scrolling Facebook’s news feed is a daily habit for millions of people. User-posted videos are one reason why.
With more than 8 billion video views per day, Facebook is a juggernaut platform for getting your video before a massive audience and for inviting engagement. Make sure that time invested in video posting is productive by learning more about Facebook metrics.
Hint: Gauging a video’s success is more than checking the number of views under the video. Those numbers, at first glance, can be deceptively high.
Insights are now in Creator Studio

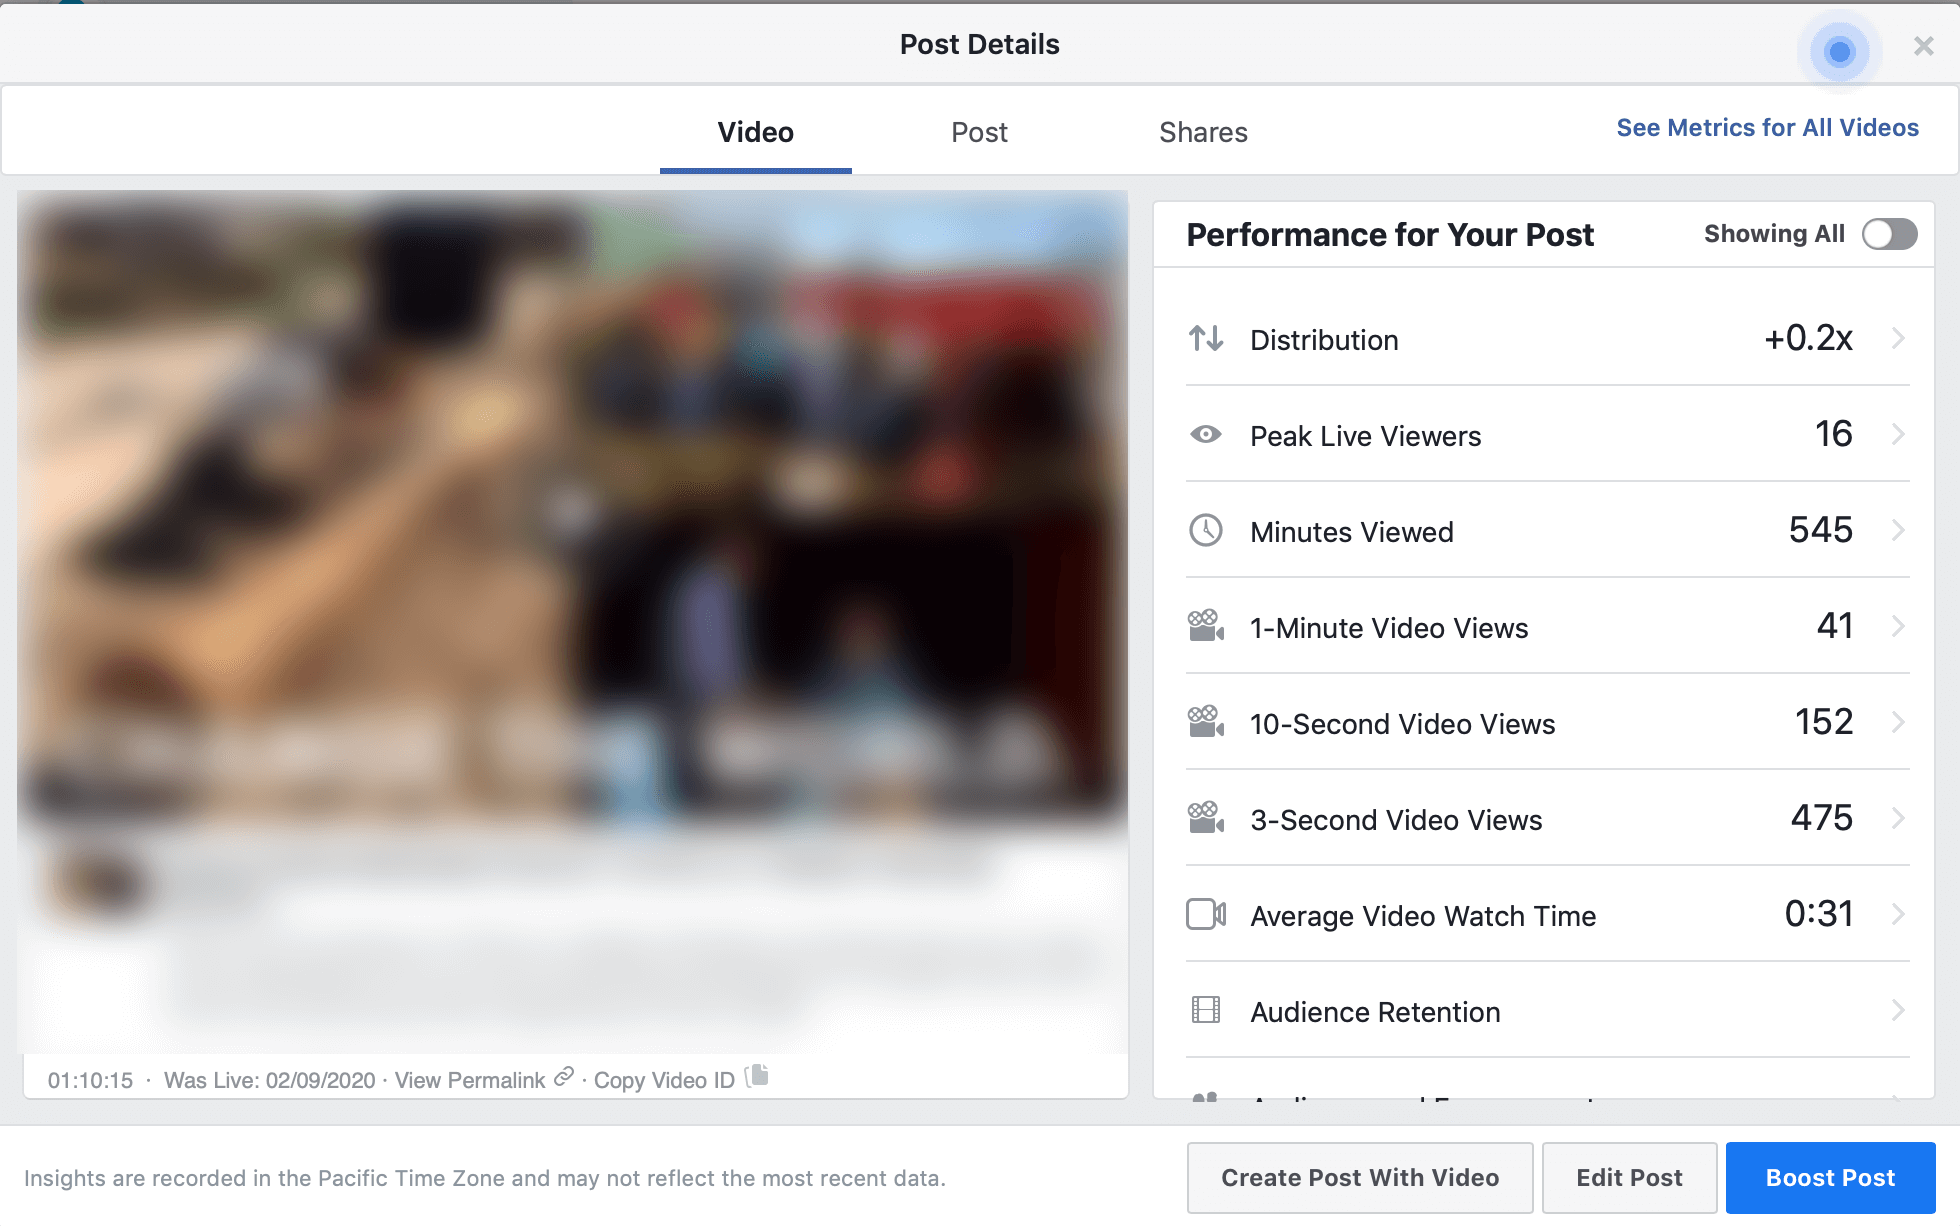
Creator Studio (accessed by the menu above a video’s cover image) is the launch point to finding the statistics for recently uploaded videos.
Video statistic basics
The generous number of views noted beside a video is a record of three-second views or approximately the time a video appears in an autoplaying news feed. The more insightful story about video engagement is found in the post details pane, where true watch times (not scroll-bys) and averages are recorded. But don’t stop there!
Understanding audience retention
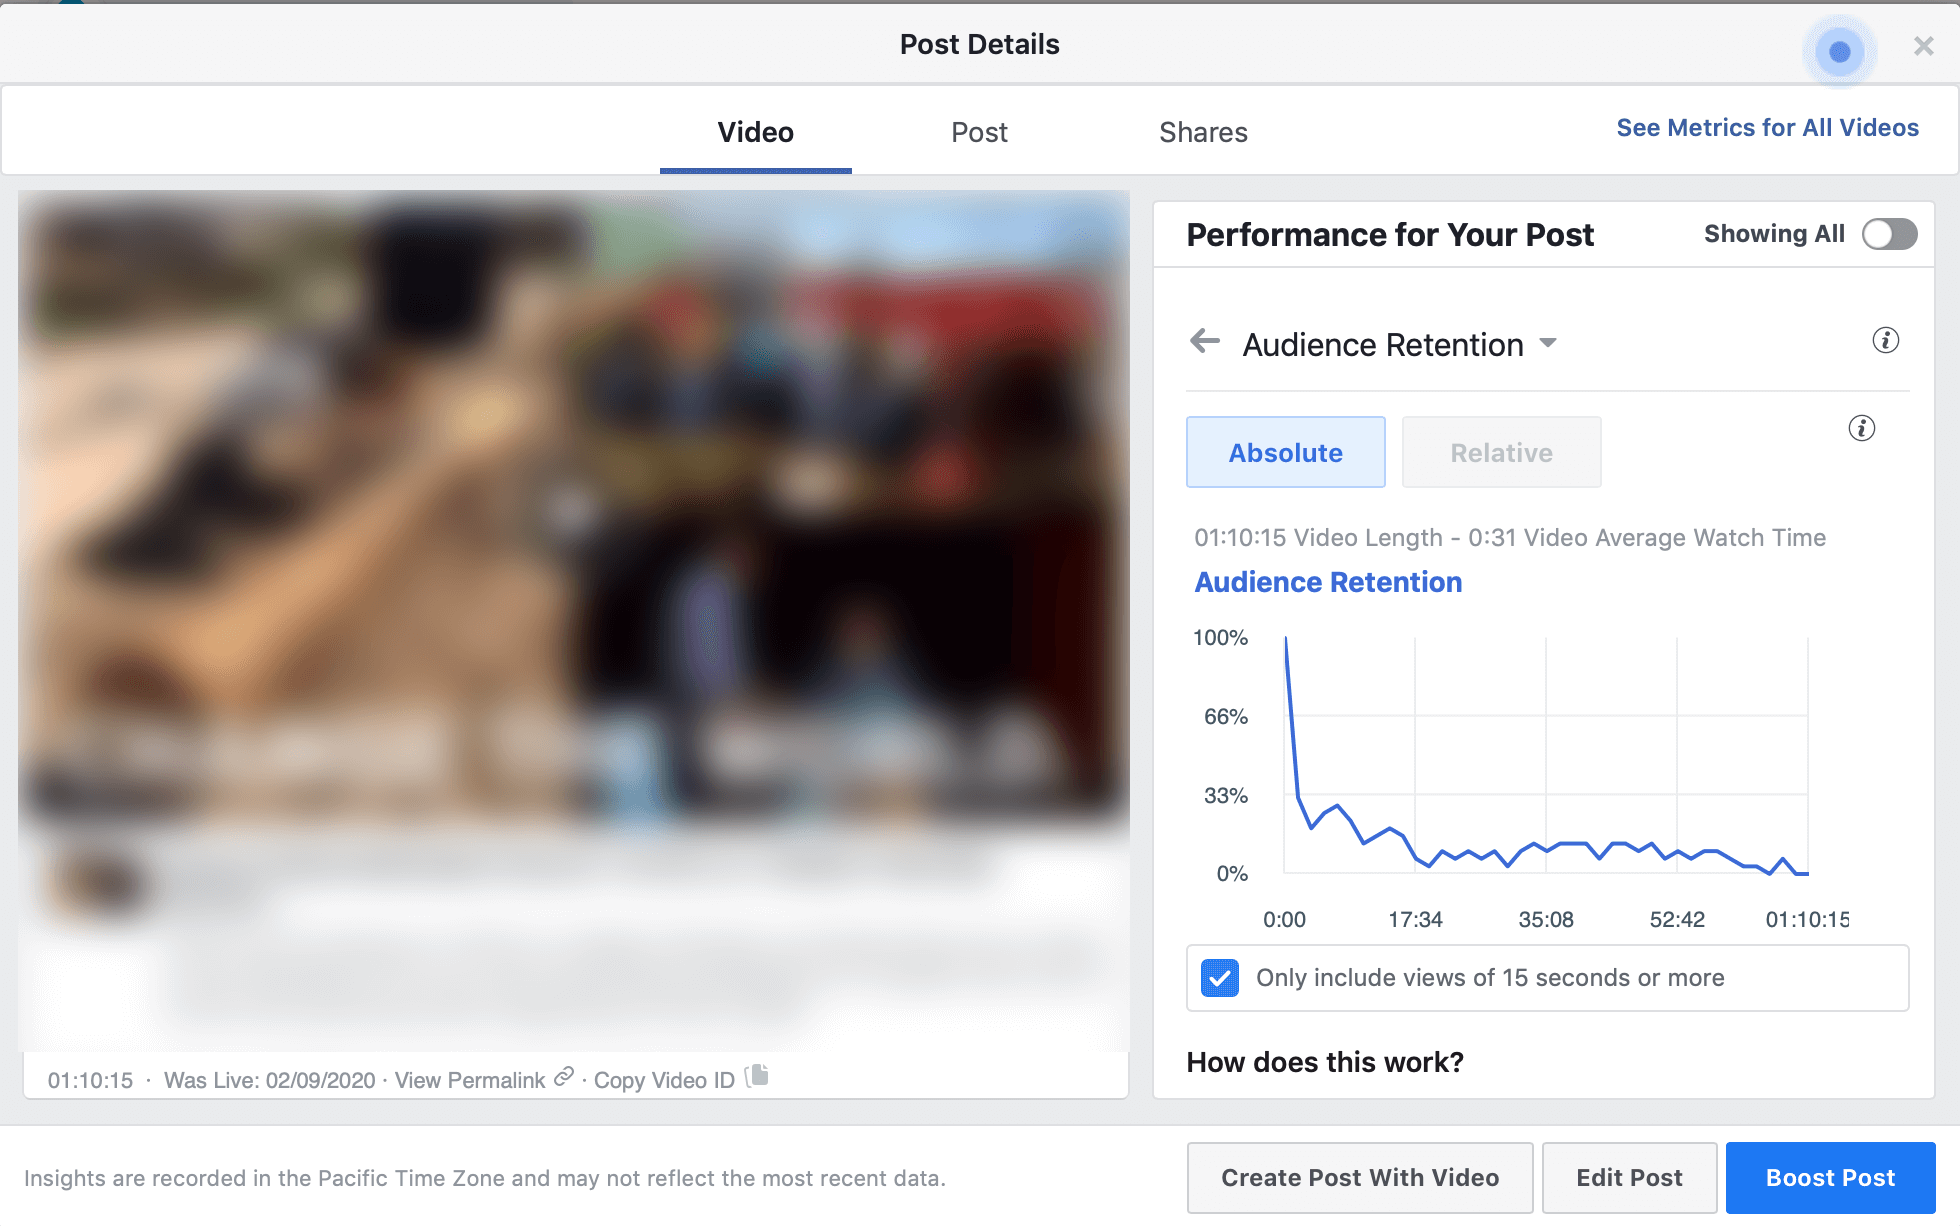
Behavioral insights on viewers are available through the audience retention graph. The line represents the percentage of people watching a video at any specific point. Audiences naturally drop off from 100% after the first seconds. Focus on what can be learned from the rest of the graph.
A sharp decrease in an audience means attention is lost. A rise on the chart (after a drop) indicates the audience skipped ahead on the video or joined late. Over time, let the data inform your content direction. After tracking your audience across several videos, tailor your content and share more videos that prove to hold an audience.

If you’re streaming worship, you may find that some portions of your service fail to translate to a Facebook audience, i.e. the passing of the peace. Edit out these segments before you post the video to Facebook.
The rest of those statistical terms
For a deeper dive into the effectiveness of your videos, click “insights” in the left pane of Creator Studio. Customize your analysis over a period of time or types of posts. To better understand your metrics, learn these terms:
- Engagement refers to people who interact in some way with your content. If they click, like, love, share or comment on your post, it’s counted in this number.
- Net followers calculates the number of new followers minus the number of unfollows within your selected options. This can be helpful in identifying posts that attract new followers and posts that are divisive or counterproductive.
- Loyalty is a term Facebook uses to describe the measures that track how often people return to your page and spend extended time engaging with your content.
Data offers knowledge and power! Study the trends of your video posts to better understand how many people are watching your them. Shape your Facebook video strategy to reach both your audience and your ministry outreach goals. Creator Studio is a powerful tool for successfully taking your posts to the next level.

Jeremy Steele is the teaching pastor at Christ UMC in Mobile, Alabama, as well as a writer and speaker. You can find a list of all his books, articles and resources for churches, including his most recent book All the Best Questions, at his website: JeremyWords.com.

