Dawn Wiggins Hare, General Secretary Becky Posey Williams, Senior Director for Sexual Ethics and Advocacy Leigh Goodrich, Senior Director of Education and Leadership Gail Murphy-Geiss, Principal Researcher
The year 2017 may eventually become known as marking an important milestone in the development of sexual misconduct awareness and response. Over the previous 25 years, although many famous men were accused of sexual misconduct, most enjoyed few or no repercussions. The beginning of that period is often considered to be when Anita Hill was called to testify in reference to Clarence Thomas’ nomination to the Supreme Court in 1991. The end of that era might be marked by the beginning of the #MeToo movement. Of course, many other cases arose in between, in politics and beyond and with varied results, including accusations against Robert Packwood, Bill Cosby, Woody Allen, Anthony Weiner, and Kobe Bryant, to name just a few. There are dozens of famous names, and there are other cases we know of, even if we do not know the individuals’ names, such as the Navy Tailhook Scandal and the Catholic Archdiocese of Boston. It is harder to find high profile women accused of sexual misconduct, but a few women became famous as a result of the revelations, such as Mary Kay Letourneau and Jennifer Fichter, two teachers found guilty of sexual misconduct with their students. This fall, the Harvey Weinstein accusations seem to be setting off the beginning of a new era. Perhaps for the first time, the victims were widely believed AND the offender experienced consequences. The public outrage was swift and strong, and the long line of similarly problematic offenders, also facing lifechanging consequences, has been numerically and emotionally overwhelming. It would be hard to find someone who has not thought highly of at least one of those on that growing list. Time has now named its Person of the Year as the “silence breakers,” honoring those who have been speaking out. While this may seem new to some, sexual misconduct reporting has been going on for a long time. The United Methodist Church has been addressing sexual misconduct for all of those 25 years, the first study of which was mandated by the General Conference of 1988, and published in 1990. A second assessment was done in 2005. This article reports on the data collected in the summer of 2017 (see the Appendix for the text of most of the questions), the landmark year noted above, but BEFORE the Harvey Weinstein allegations hit the news. In other words, these findings may be outdated before they are even discussed, due to raised awareness over just the last few months. Still, they represent many United Methodists’ knowledge of, experiences of, and opinions about sexual harassment in the church, its agencies and seminaries at the end of this important 25-year period.
The Sample
Previous surveys were limited, as they had to be completed on paper and collected through the mail. Last year, the survey was distributed via the internet to two major samples. One list was a random sample of 500 clergy and 500 laity from various positions of leadership as listed in Annual Conference Journals and/or on Annual Conference websites, in numbers proportional to their representation at the General Conference. In addition, leaders of various constituencies were contacted and asked to distribute the survey. This included Conference Communications Directors, the Council of Bishops, Chancellors, Cabinets, Assistants to the Bishop, Staff Parish Relations Committee Chairpersons, Lay Servants and Lay Leaders, Boards of Ordained Ministries, Trustees, Missionaries, Children/Youth Ministers, Deaconesses and Home Missioners, Camp Directors, Safe Sanctuaries Leaders, Annual Conference Human Resource Contacts, and United Methodist Seminaries and Licensing Schools. Because the purpose of the survey was partly comparative, the data for all three surveys (1990, 2005 and 2017) were collected from participants in the United States only. We hope to begin to study sexual misconduct in the Central Conferences in the upcoming year. In the end, 4374 people completed all or most of the survey.
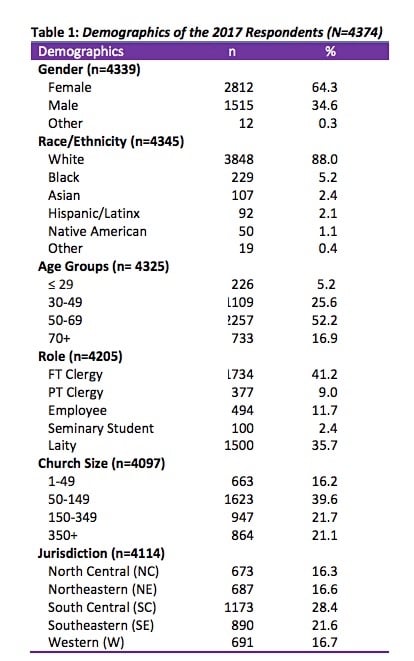
It is very difficult, perhaps impossible, to gather responses from a truly random sample of United Methodists, and this sample is no exception. These data come from a “convenience” sample, but a very large one, drawn as widely and representatively as possible. Table 1 shows the main demographics of the respondents. Those with multiple racial categories were coded into one category based on the “one drop” rule, common in US racial politics and personal interactions.1 That is, if an individual has one drop of non-white “blood,” the person would be treated by others as a person of color. Also, those who indicated their role as clergy/laity and also employee or student were coded as employee or student, since the latter are smaller groups and the experience particular. Especially notable here is the high response rate from the Western Jurisdiction (16.7%) compared to their percentage in the denomination 1 Ho, A., N. Kteily and J. Chen. 2017. “You’re One of Us.” Journal of Personality and Social Psychology, 113 (5): 753- 768. 3 (4.4%), and similarly, the low response rate from the Southeastern Jurisdiction (21.6%) compared to their real presence (38.9%). It is also notable that there was at least one response from each Annual Conference in the United States. Still, these responses cannot be considered representative of the membership or even the leadership across the United States. That said, with such a large number of respondents, the data are likely indicative of larger patterns.
Knowledge
The first section of each survey administered since 1990 focused on knowledge. In 1990, the lead questions were about the definition of sexual misconduct. Respondents were asked to define the term and indicate examples of problematic behaviors. By the next survey in 2005, it was assumed that people knew what sexual misconduct was, so a definition was provided and respondents were asked if they knew about the denomination’s response to it. That model was repeated in this study to track change over time.
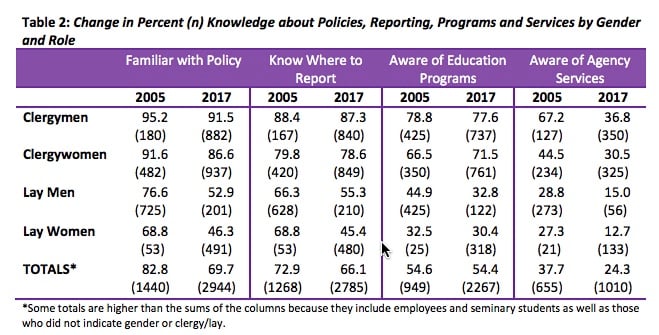
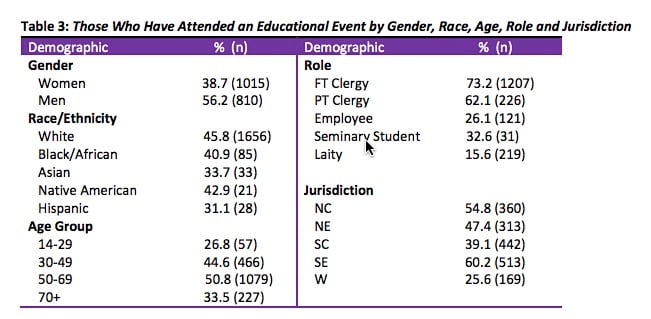
Table 2 shows the changes in the percentage of clergy and laity who know about United Methodist policies, where to report an incident, educational programs, and agency services for victims. Knowledge about policies, where to report and agency services has declined for men and women, clergy and lay, and in many cases, the decline is quite large. In addition, in 2017 only, a box was provided for people to write in the name of the agency they know, but 288 people didn’t write anything at all, and a few were incorrect, such as “I’d call GCORR (the General Commission on Religion and Race) and ask” or “local law enforcement.” Others were vague, such as “I would call the DS (District Superintendent) to find out” or “I’d have to look but I would know how to start.” In other words, it is likely that awareness of agency services is lower than indicated. The only increase over the last 12 years is regarding clergywomen’s awareness of educational programs. Fewer than half (44.9%, n = 1842) of all respondents reported having attended an educational event, although such attendance varies based on gender, role, and Jurisdiction, as seen in Table 3. Men, whites, those aged 50-69, clergy and those from the Southeastern Jurisdiction are most likely to have attended 4 such events, and women, Hispanics, the youngest respondents, laity, and those from the Western Jurisdiction are least likely to have attended one.
Experiences of Sexual Misconduct
Reports of experiences of sexual misconduct can be compared over the three survey years, as seen in Table 4. Overall, reports of sexual misconduct went up between 1990 and 2005, perhaps due to awareness and increased educational programs, many now required by Annual Conferences and seminaries. Since 2005, reports have declined for everyone except seminary students.

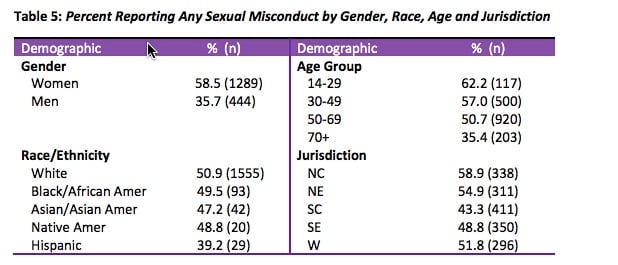
Table 5 displays the rates of sexual misconduct experience reported in 2017 only, by demographic group. Women, whites, and young respondents were the most likely to report such experiences. Those from the two southern Jurisdictions were least likely to report experiences of sexual misconduct.
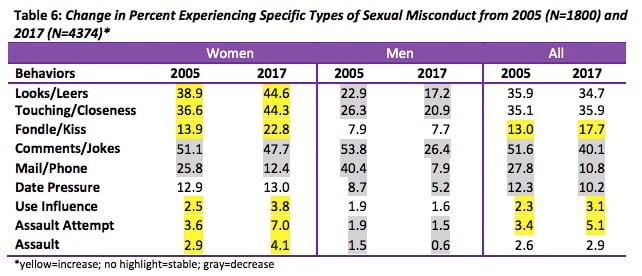
Sexual misconduct experiences were then broken down into type, as seen in Table 6, listed in the order asked in the 2017 survey. In 2005, men reported experiencing more inappropriate comments/teasing/jokes and mails/calls, but in 2017, all types were more commonly experienced by women respondents. It is hard to know what might be going on over time, as some types remained quite stable (not highlighted), some increased (yellow) and some decreased (gray). Neither data set represents a random sample, so any change may be simply due to chance, but if either study is representative, it is more likely the 2017 data because of the larger number of respondents (1800 in 2005 compared to 4374 in 2017). Overall though, change over time depends on the specific behavior, but it also appears that men are experiencing less sexual misconduct, and women are experiencing more. That, or as we may be seeing in the popular media, women are more likely to recognize and/or report it as such.
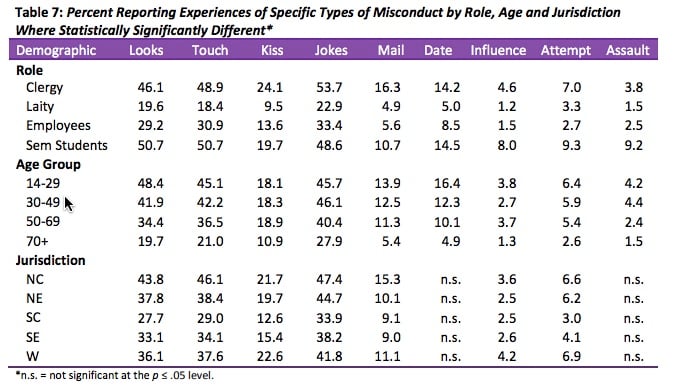
These behaviors also differed based on role, age group, and Jurisdiction, as seen in Table 7. Pressure for dates and completed assaults were not associated with Jurisdiction, but for all other behaviors, the associations with grouping variables are statistically significant at p ≤ .05. Overall, clergy are more at risk to experience all behaviors than laity, and younger persons report misconduct more than older groups. In fact, as age increases, reported experiences decrease. Patterns are less clear in the Jurisdictions, but 6 the North Central and Western Jurisdiction participants reported more misconduct, depending on specific behavior, than respondents from the other three regions.
Settings
The most commonly reported site for incidents were public settings (41.9%) such as meetings, classes or events. Private settings, such as offices, homes and hotel rooms were the second most common settings (31.4%). More rarely, incidents occurred during worship (15.4%), in written/online documents or over the phone (11.3%), although these rates differed by the gender of the respondent, as seen in Table 8

In addition, most incidents occurred in churches (58%) with 27.3 percent occurring in offices and 14.7 percent in school settings. These percentages are not significantly different from those reported in 2005, obviously, because more United Methodists are located in churches than in offices or schools
Perpetrators
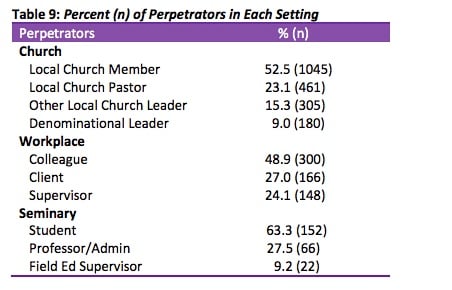
Interestingly, the most common perpetrator in each setting is not a person of great power, at least as traditionally defined. Certainly, in the workplace and school, colleagues and fellow students are not more powerful than others in those locations, but the local church is different. A member COULD be powerful, if a long time member or a generous giver, for example. Like clients in a workplace, it is difficult to tell a “customer” that they have sexually harassed you, for fear they will leave and take their business elsewhere. The breakdown of perpetrators by site of the incident is shown in Table 9.
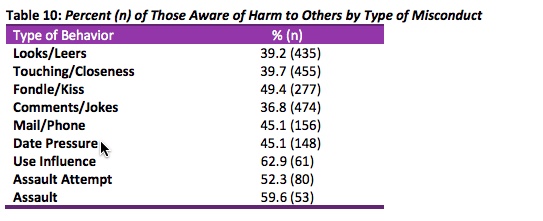
Most respondents (53.6%) said they were not aware of their perpetrator harming anyone else, but almost one-third (32%) said they knew of others, while the remainder (14.4%) were unsure. Those experiencing some of the most severe forms of sexual misconduct were the most likely to know of others being harmed. This, of course, is alarming, in that the worst offenders are not committing isolated incidents. The percentages of those who said they knew or suspected harm to others based on the type of behavior is shown in Table 10.
Reactions and Effect
The most common response to sexual misconduct is to avoid the person (50.8%) or ignore the behavior (46.3%), although there is some difference by gender and age, with women more likely than men to 8 avoid the person and older and younger people more likely than middle-aged respondents, to ignore the behavior, as seen in Table 11. Also notable is that women and younger respondents are more likely than others to tell a supervisor, request a transfer, or quit.

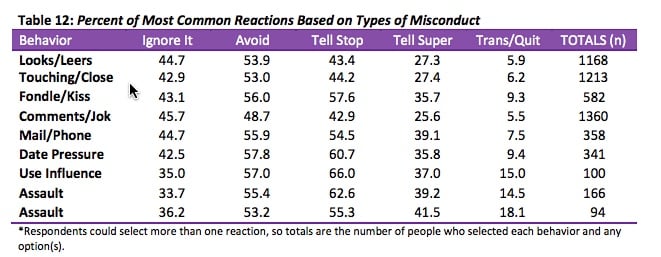
Responses also differ a bit depending on the exact behavior. Most notably, the response of telling someone to stop is more likely than avoidance or ignoring for the more serious incidents, as seen in Table 12. In addition, the more serious incidents are more likely to lead to a report to one’s supervisor or a request to transfer or quitting.
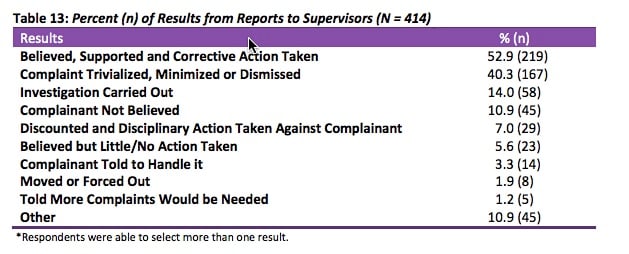
For those who made a formal report to a supervisor, the most common reaction was that they were believed, supported and corrective action was taken (52.9%), but that was closely followed by the second most common result, which was that the complaint was minimized, trivialized or dismissed (40.3%). All responses appear in Table 13. Note that quite a few respondents who made such a report to a supervisor selected “other” (n = 95; 22.9%), and a full quarter of them (n = 23) wrote in that they were believed, as in the most common response, but that very little or nothing was done. Another 27 of the “other” respondents (6.4% of those reporting to a supervisor) wrote in negative reactions, including being told to handle it themselves (n = 14; 3.3%), being moved or forced out (n = 8; 1.9%), or told that more than one complaint would be necessary to make a case (n = 5; 1.2%). In one case, the complainant was told she needed a letter from a counselor to show that she was a credible accuser.
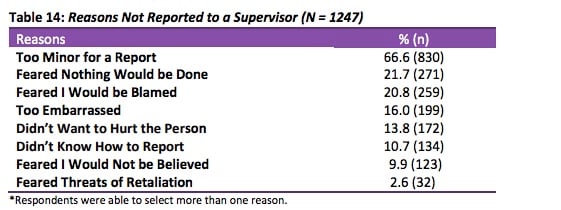
As for those who did not report, the most common reason was that the respondent thought the behavior was insignificant and therefore not worthy of a complaint (n = 830; 66.6%). All of the reasons for not making complaints appear in Table 14.
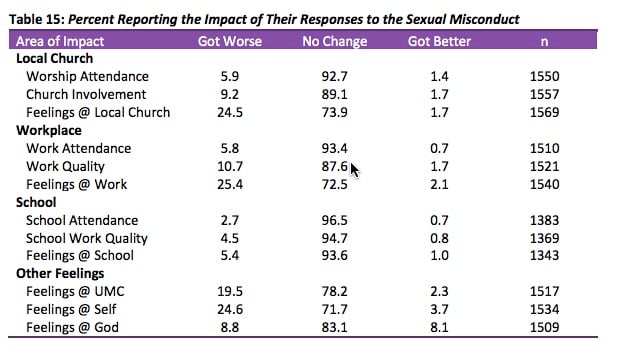
Of the 1667 respondents who reported on the results of their responses (including all responses – not only those making formal complaints), almost half (43.5%) felt that things got better overall. About one quarter (25.2%) said there was little change, and for 61 people (3.7%), things got worse. The remaining quarter (27.7%) said they were either unsure of the results, or their experiences were multiple and the results varied. The specific areas of their lives that got better or worse yielded more negative opinions and varied quite a lot, as seen in Table 15. Note that respondents’ feelings about their local church, their work, the denomination, and themselves were the most likely to get worse. Feelings about school and God were less negatively impacted, and in fact, one’s feelings about God were more likely to get better than any other area of life listed.
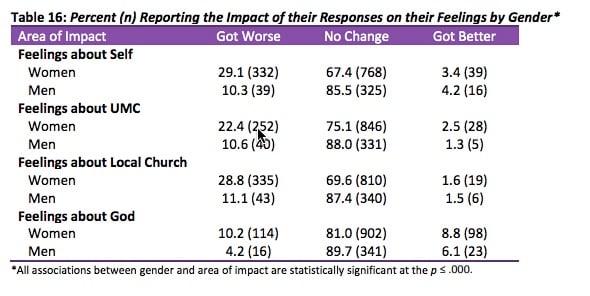
Some of the impacts were quite different, based on gender, as seen in Table 16. In each case, women were more likely than men to report that their feelings about self, church and God got worse.
Opinions
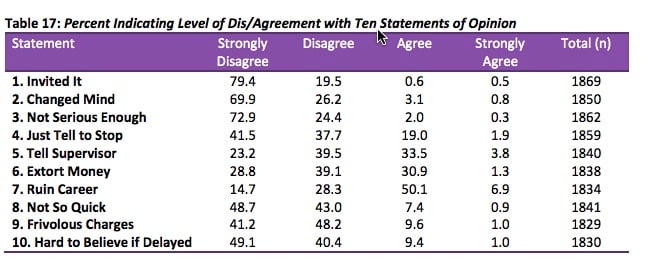
A new section asking about opinions2 about sexual misconduct was added to the 2017, and about 1850 respondents completed that section. The ten statements asked respondents to indicate their level of agreement, on a scale of 1 (strongly disagree) to 4 (strongly agree). The statements were as follows: 2 Lonsway, Kimberly, Lilia Cortina and Vicki Magley. 2008. “Sexual Harassment Mythology.” Sex Roles 58:599-615. 11 1. If a person is sexually harassed, s/he must have done something to invite it. 2. Many sexual assault victims are actually people who had sex and changed their minds afterwards. 3. If someone doesn't make a complaint, it probably wasn't very serious to be sexual harassment. 4. People can usually stop unwanted sexual attention by telling the person that it is not appreciated. 5. People can usually stop unwanted sexual attention by reporting it to a supervisor. 6. Sometimes people make up allegations of sexual harassment to extort money from their employer. 7. A person can easily ruin a supervisor's career by claiming that s/he "came on" to him/her. 8. People shouldn't be so quick to take offense when someone at work expresses sexual interest. 9. People often file frivolous sexual harassment charges. 10. It is difficult to believe sexual harassment charges that were not filed at the time. Before looking at the differences of opinions by gender, age, race and role (Jurisdictional differences were not statistically significant), the responses for the full sample are shown in Table 17. Note that the highest agreement is with the idea that complaints against people can ruin their careers, and the strongest disagreement was with the idea that the targets of sexual harassment invite the attention. Also, while many Americans seem concerned about delayed complaints as false, that does not seem to be a concern for most of these respondents.
To make comparison by group easier, each statement is assigned an average score, on the scale mentioned above, between 1 (strongly disagree) and 4 (strongly agree). These means and standard deviations appear in Table 18, all of which are statistically significantly different at the p ≤ .000 level.
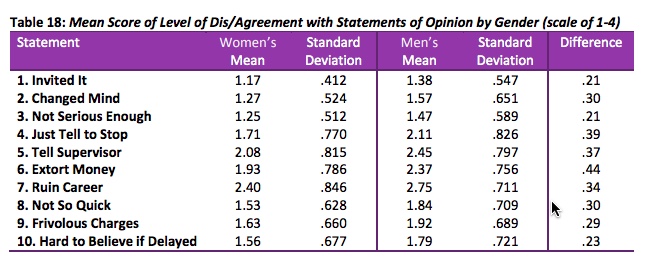
Note that both men and women indicate the strongest agreement with the statement about complainants using their accusations to extort money, but men’s agreement is stronger than women’s, achieving the only mean higher than the midpoint of 2.5. That is, on average, men agree with that statement more than they disagree. The least agreement is with the statements about inviting the attention and behavior not serious enough to report, but women disagree more strongly than men do. In fact, women’s agreement is lower for every statement.
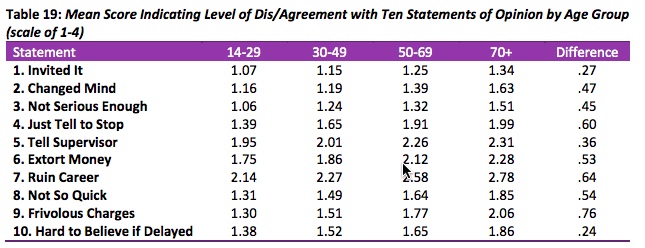
Table 19 shows the mean scores for each question by age group. Note that older United Methodists are more likely to agree with all of the statements, and in fact, agreement rises steadily over each age cohort. The statement with the widest difference of opinion is the one about whether people file frivolous sexual harassment charges. The lowest level of difference is around the issue of delayed reports being hard to believe. Research on opinion about sexual harassment shows a generation gap regarding the understanding of behaviors considered sexually harassing. Specifically, young people see sexual harassment where older adults do not.3 That gap is clearly also present in the United Methodist Church.
3 DATA TEAM. Nov. 17, 2017. “Overly-friendly or Sexual Harassment? It Depends on Whom You Ask. The Economist.
Opinions differed (p ≤ .05) by race and ethnicity on only five of the statements, as seen in Table 20.

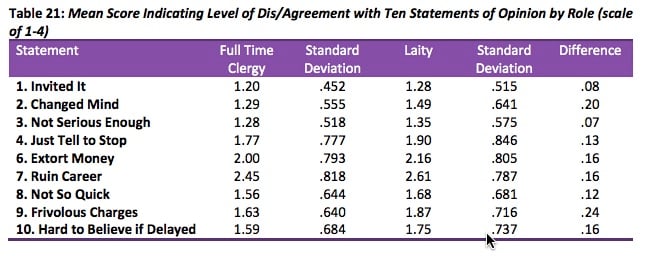
Asian and Asian American respondents were most likely to agree with four of the statements, all except the one about frivolous charges, which was most affirmed by black and African respondents. Lowest agreement shows less of a pattern, twice by whites (# 4 and #5), twice by Native Americans (#1 and 10) and once by Hispanics (#9), though the differences are all fairly small. Differences by role when comparing only full time clergy and laity are statistically significant (p ≤ .05) for nine of the statements, as seen in Table 21. For every statement, laity agree a bit more than clergy, although most differences are small. The biggest difference is concerning their opinions on whether people file frivolous charges.
Key Findings
Knowledge about policies, where to report and agency services has declined for men and women, clergy and lay, and in many cases, the decline is quite large. The only increase in knowledge over the last 12 years is regarding clergywomen’s awareness of educational programs. Fewer than half (44.9%) of all respondents reported having attended an educational event, although such attendance varies based on gender, role, and Jurisdiction. 14 Experiences of sexual misconduct went up between 1990 and 2005, perhaps due to awareness and increased educational programs, many now required by Annual Conferences and seminaries. Since 2005, reports have declined for everyone except seminary students. Women, whites, and young respondents were the most likely to report such experiences. Those from the two southern Jurisdictions were least likely to report experiences of sexual misconduct. Overall, it appears that men are experiencing less sexual misconduct, and women are experiencing more. Overall, clergy are more at risk to experience all behaviors than laity, and for all groups, as age increases, reported experiences decrease. Most incidents (41.9%) occurred in public settings such as meetings, classes or events. Local church members, workplace colleagues, and seminary students were the most likely offenders in each setting. Most respondents (53.6%) said they were not aware of their perpetrator harming anyone else, but those experiencing some of the most severe forms of sexual misconduct were the most likely to know of others being harmed. The most common response to sexual misconduct was to avoid the person (50.8%) or ignore the behavior (46.3%), although there is some difference by gender and age, with women more likely than men to avoid the person and older and younger people more likely than middle-aged respondents, to ignore the behavior. Women and younger respondents were more likely to tell a supervisor, request a transfer, or quit. In addition, the more serious incidents are more likely to lead to a report to one’s supervisor or a request to transfer or quitting. For those who made a formal report to a supervisor, the most common reaction was that they were believed, supported and corrective action was taken (52.9%), but that was closely followed by the second most common result, which was that the complaint was minimized, trivialized or dismissed (40.3%). Respondents’ feelings about their local church, their work, the denomination, and themselves were the most likely to get worse. Feelings about school and God were less negatively impacted. Regarding opinion statements, respondents were concerned about complainants’ ability to ruin someone’s career, but they are not as concerned about victims inviting sexual attention. 15
Works Cited
DATA TEAM. 11/17/17. “Overly-friendly or Sexual Harassment? It Depends on Whom You Ask. The Economist. Ho, A., N. Kteily and J. Chen. 2017. “You’re One of Us Black Americans' Use of Hypodescent and its Association with Egalitarianism.” Journal of Personality and Social Psychology, 113 (5): 753-768. Kolbert, Elizabeth. 10/15/1991. “The Thomas Nomination; Most in National Survey Say Judge is the More Believable. New York Times. Lonsway, Kimberly A., Lilia M. Cortina and Vicki J. Magley. 2008. “Sexual Harassment Mythology: Definition, Conceptualization and Measurement.” Sex Roles 58:599-615. Tolentino, Jia. 11/11/17. “Listening to What Trump’s Accusers Have Told Us.” The New Yorker.
