by Amanda Mountain & Rev. Leigh Goodrich
A total of 864 delegates will meet from May 10-20th in Portland, Oregon to revise church laws, adopt new ones, and approve plans and budgets for church-wide programs. Half of the delegates are laity, half are clergy, and the number of delegates representing each jurisdiction and each annual conference is proportional to the jurisdiction and annual conference’s membership. For the next two months, Women by the Numbers will be taking a closer look at who will be at this decision-making table in May, especially regarding the representation of women at General Conference. This month we will provide a closer look at the 504 delegates from the United States, who make up 58% of all General Conference delegates.
.
As a review, 44% of the delegates from the United States are female, 56% are male. In addition, 36% of clergy delegates are clergywomen and 64% are clergymen, while 52% of lay delegates are women and 48% are men. The United Methodist Church in the US is divided into 5 regional areas called jurisdictions, and then into Annual Conferences within each jurisdiction. The addendum included with this article shows the breakdown of delegates by annual conference.

- Total: 44% are female and 56% are male
- Clergy: 36% female/64% male
- Laity: 52% female/48% male
The United Methodist Church in the US is divided into 5 regional areas called jurisdictions. These are the Southeastern, South Central, Northeastern, North Central, and Western Jurisdictions. Each Annual Conference within the United States resides in one of these regional jurisdictions. Below, Women by the Numbers provides a breakdown of delegate representation by jurisdiction.
2016 Numbers:
- SEJ
- 41% female delegates/59% male
- Clergy- 33% female/67% male
- Lay- 49% female/51% male
- SCJ
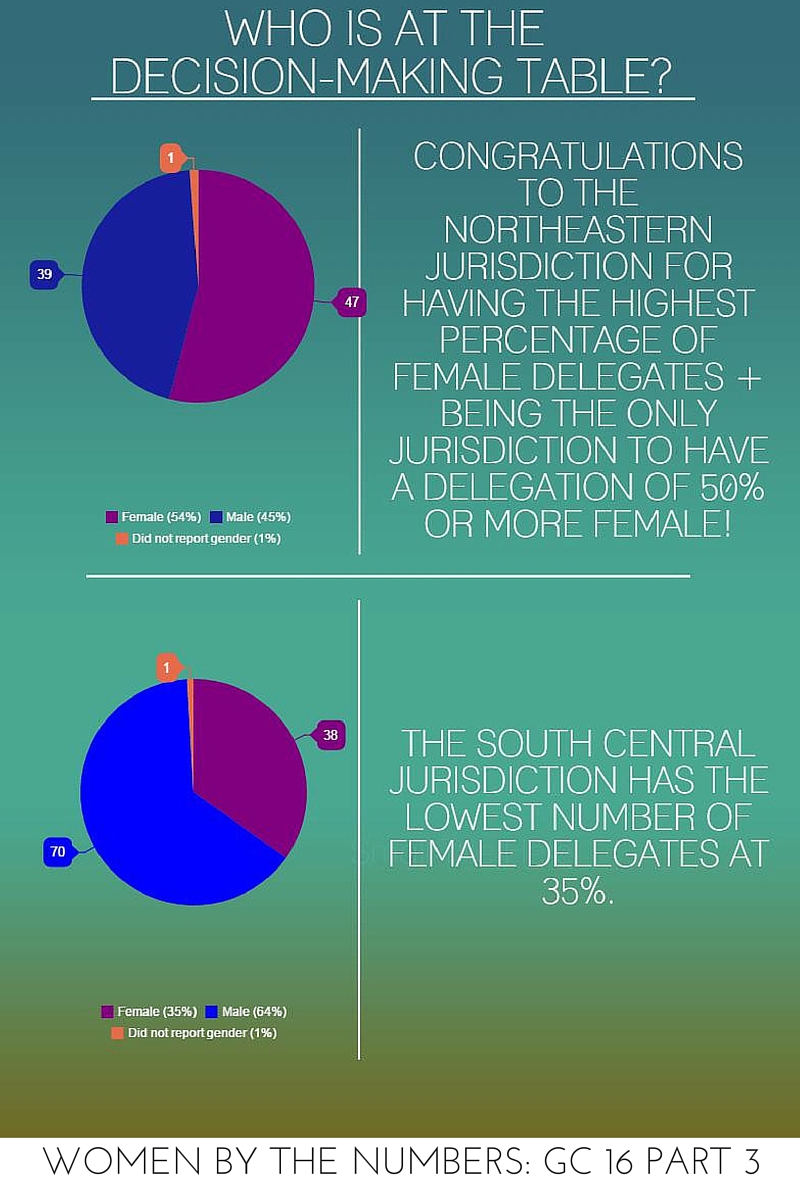
- 35% female delegates/64% male*
- Clergy- 31% female/69% male
- Lay- 39% female/ 61% male
- *does not equal 100% because 1 delegate did not report gender
- NEJ
- 54% female delegates/45% male *
- Clergy- 48% female/52% male
- Lay- 64% female/36% male
- *does not equal 100% because 1 delegate did not report gender
- NCJ
- 49% female delegates/51% male
- Clergy- 39% female/ 61% male
- Lay- 59% female/ 41% male
- WJ
- 47% female delegates/ 53% male
- Clergy- 40% female/60% male
- Lay- 53% female/ 47% male
Summary of Jurisdictions:
The Northeastern Jurisdiction has the highest percentage of female delegates at 54%, and is the only jurisdiction where the delegation is 50% or more female. The South Central Jurisdiction has the lowest number of female delegates at 35% of its delegation being women. Interestingly, when looking at clergy and lay categories, clergywomen account for less than 50% of all clergy delegates from the US in all jurisdictions. The South Central Jurisdiction has both the lowest percentage of clergywomen (31% of all clergy), and the lowest percentage (39%) of all female lay delegates. The Northeastern Jurisdiction has the most at 48% of clergywomen delegates and 64% of its lay delegates being women.
Comparison to 2012 Delegate numbers:
- 2016 Total Numbers
- Total: 44% female/ 56% male
- Clergy: 36% female/64% male
- Laity: 52% female/48% male
- 2012 Total Numbers
- Total: 44% female/56% male
- Clergy: 39% female/61% male
- Laity: 50% female/50% male
Overall, the number of female delegates from the US stayed the same at 44%, but the number of clergywomen delegates went down from 39% in 2012 to 36% in 2016. The percentage of laywomen delegates is up from 50% in 2012 to 52% in 2016, a marginal increase at best. Most of the jurisdictions did not see much change in female representation among their delegations, except for the Western and Northeastern Jurisdictions. Female delegates from the Western Jurisdiction actually dropped from 63% in 2012 to 47% in 2016, while they increased in the Northeastern Jurisdiction from 49% female in 2012 to 54% in 2016. The number of clergywomen delegates from the Western Jurisdiction also dropped from 39% in 2012 to 36% in 2016, and the number of lay women delegates went down from 75% in 2012 to 53% in 2016. The number of clergywomen delegates from the Northeastern Jurisdiction increased from 44% clergy being female in 2012 to 48% in 2016.
Summary:
Similar to the Central Conferences, women have not gained much ground in representation among delegates to General Conference within the United States. In fact, women are losing ground in some areas. Why the stagnancy and why the decline?
Next time, Women by the Numbers breaks down the delegates by Annual Conference.
- 2016 Numbers
- SEJ- 41% female delegates/59% male
- Clergy- 33% female/67% male
- Lay- 49% female/51% male
- SCJ- 35% female delegates/64% male
- Clergy- 31% female/69% male
- Lay- 39% female/ 61% male
- NEJ- 54% female delegates/45% male
- Clergy- 48% female/52% male
- Lay- 64% female/36% male
- NCJ- 49% female delegates/51% male
- Clergy- 39% female/ 61% male
- Lay- 59% female/ 41% male
- WJ- 47% female delegates/ 53% male
- Clergy- 40% female/60% male
- Lay- 53% female/ 47% male
- 2012 numbers
- SEJ- 42% female/58% male
- Clergy- 38% female/62% male
- Lay- 45% female/ 55% male
- SCJ- 38% female/62% male
- Clergy- 33% female/67% male
- Lay- 44% female/56% male
- NEJ- 49% female/51% male
- Clergy- 44% female/56% male
- Lay- 55% female/45% male
- NCJ- 46% female/54% male
- Clergy- 39% female/61% male
- Lay- 52% female/48% male
- WJ- 63% female/38% male
- Lay- 53% female/ 47% male L
- Lay- 75% female/25% male
See more Women by the Numbers, including all of the Who Is At the Decision-Making Table? series, on our Women by the Numbers archives.
